Selecting a Data Series
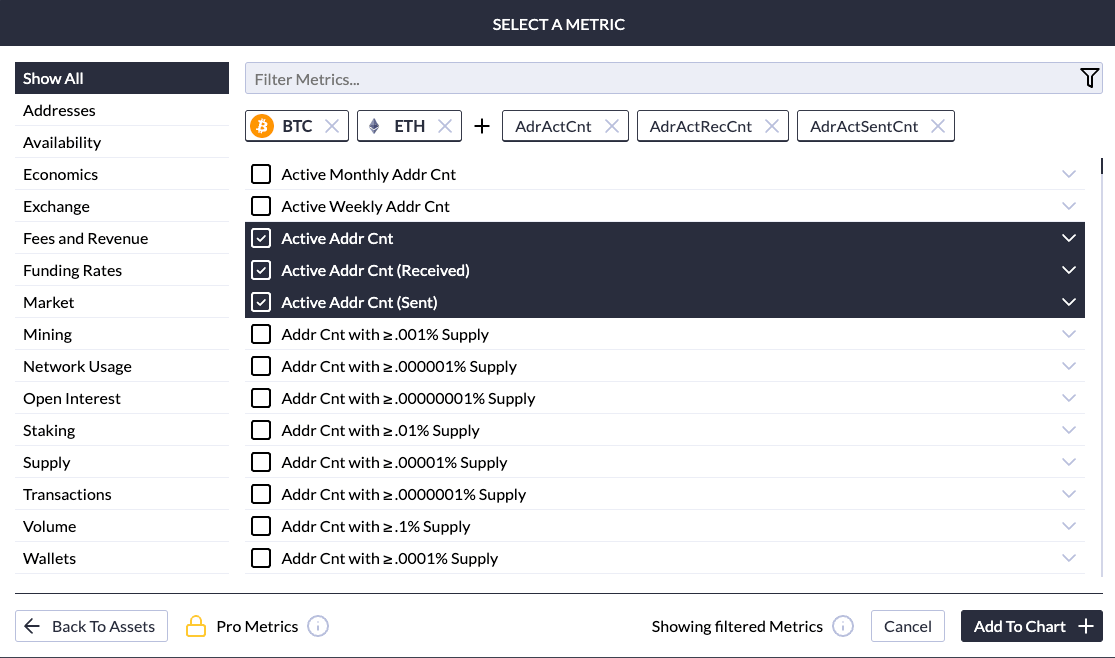
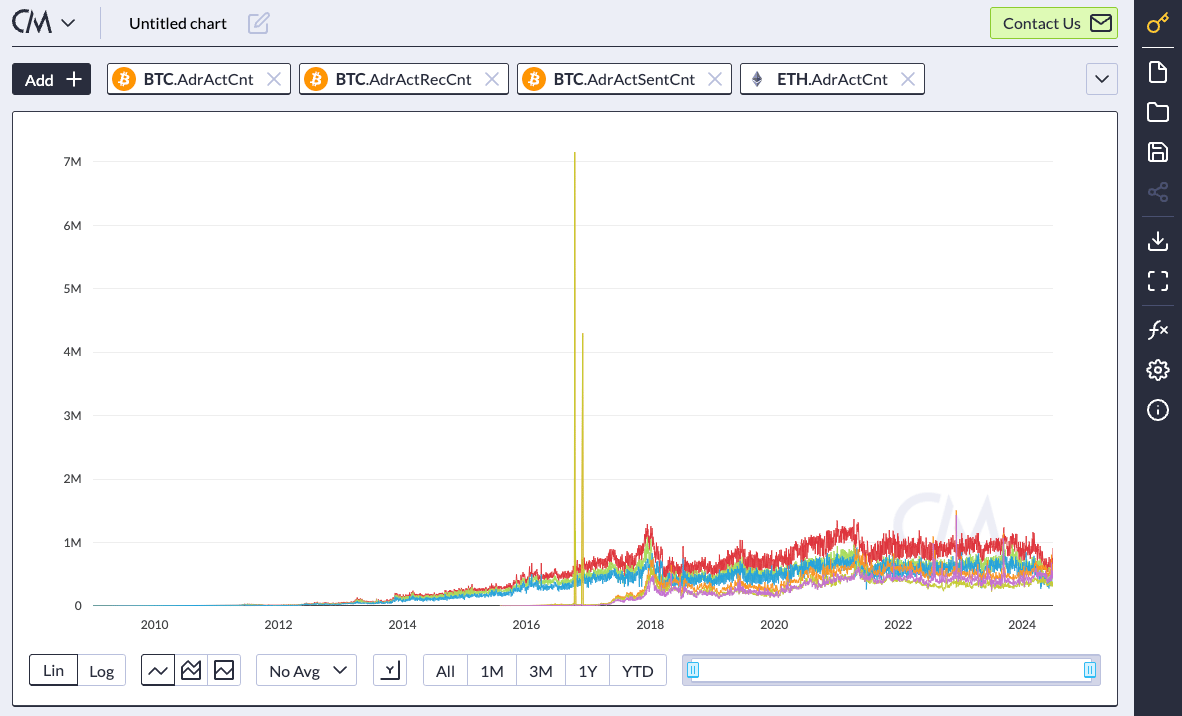
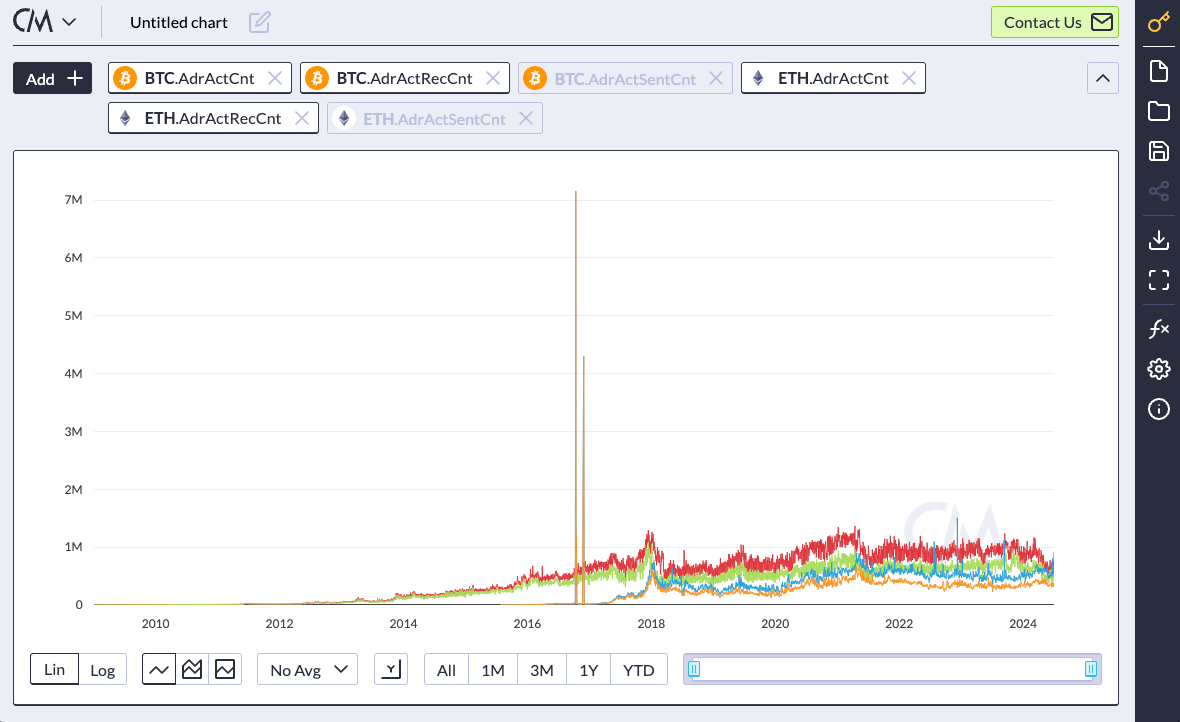
The Charting Tool allows you to easily visualize our Asset Metrics. Simply select the “Add” button from the top left selection dialogs.



Handling of Data Gaps
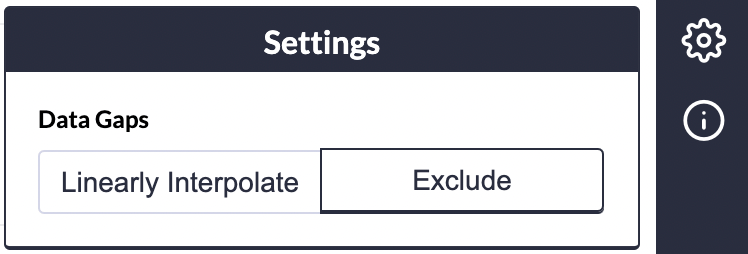
On occasion, you may want to compare a continuous data series with one with gaps (such as when you compare cryptoasset returns with a traditional index like S&P500 that has no values on the weekends or holidays). The tool gives you two options for handling this:- Linearly interpolate the data to derive a value for the data gap prior to calculating the returns
- Exclude the observations on the dates where one data series has a gap, but the other doesn’t prior to calculating the returns (note: this results in fewer observations for the non-gapped series)
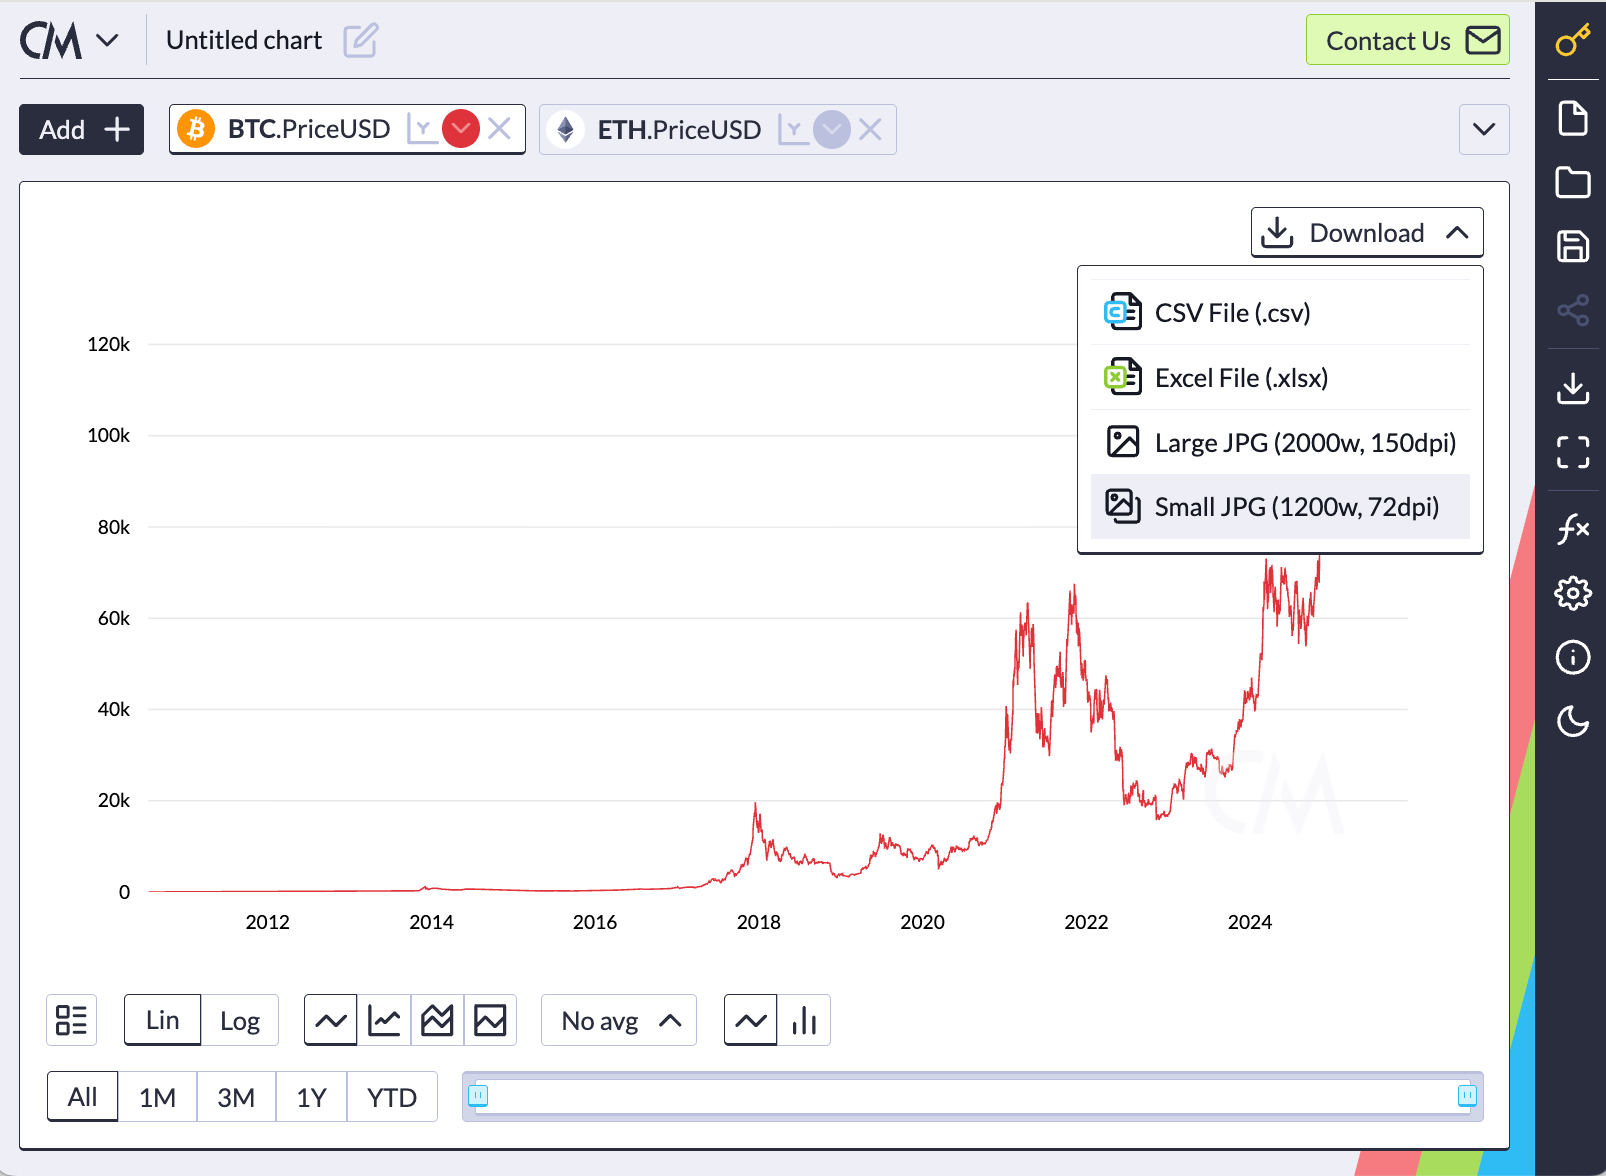
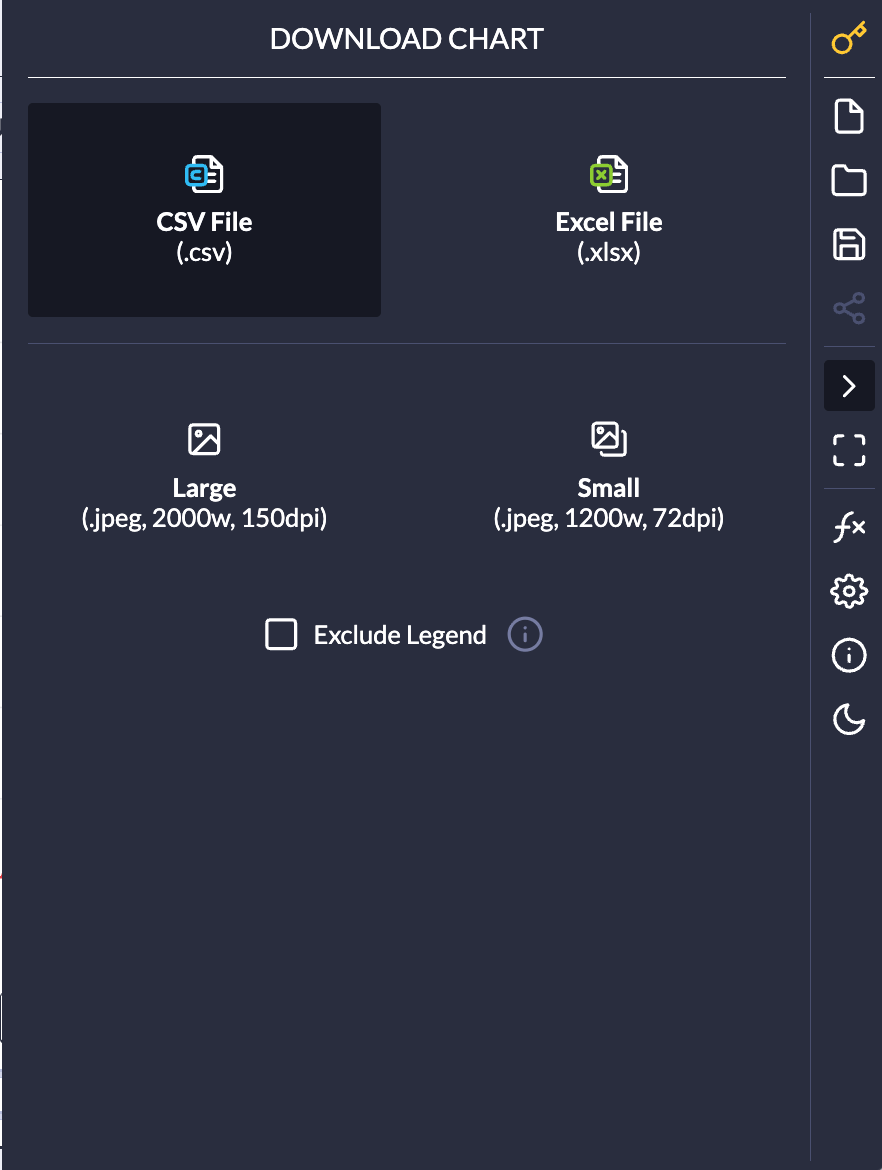
Downloading Data
Once your asset-metric pairs are plotted, you can take the data or the chart with you. Select the download button in the top left of the charting frame and choose CSV or Excel for the underlying data, or JPEG for the chart image. Chart images include the legend by default.