

Correlation Coefficient
A correlation coefficient is a number between -1 and 1 measuring the strength of a relationship between two variables. A positive correlation means that returns move together. If you plotted returns of two cryptoassets on a scatterplot, dots sloping upwards and right in a diagonal line would imply a positive correlation. Note that no causality is inferred. The actual derivation involves taking the covariance of two variables. Covariance tells you whether two variables move together or not, but it is unbounded and unstandardized. Finding a correlation involves standardizing those arbitrarily large figures by dividing by the sample standard deviations of both variables. This reduces covariance to a range between -1 and 1, and it is now informative as to the magnitude of moves between two assets. Put simply correlation tells you:- whether two variables are related, and
- the magnitude of their inter-relatedness
Tool Options
The tool offers the user several options for determining the correlation coefficient:- Pearson vs. Spearman
- Log vs. Arithmetic Returns
- Timeframe: 30/60/90/180/360 days
- Handing of Data Gaps: Linearly Interpolate or Exclude
Pearson and Spearman Correlation
Our tool presents two options for correlation: Pearson and Spearman Correlation.
Pearson
Pearson correlation basically assumes that the relationship between the two variables is linear, and it measures it on this basis. If you have nonlinear yet meaningful relationships, Pearson will report a weak correlation, when in fact there may be something interesting going on behind the scenes. One solution to this problem is using log daily returns, which helps in processing data, and has some other useful properties if the data is normally distributed.Spearman
To give our users an alternative, we introduced Spearman correlation. Spearman correlation takes a ranking of all the data points in the sample, and then it runs a Pearson correlation on the rankings data. It then compares the two variables based on how much their rankings move together. This enables the ability to capture co-movements in datasets that are nonlinear. Spearman would find the correlation between a perfect exponential relationship as 1, whereas Pearson would declare it positive but not perfectly correlated. For more on this, we suggest reading this excellent breakdown in the differences between the two. To put it simply: if you think your variables are linearly related, and you want to measure the strength of those co-movements, use Pearson correlation. If you want to capture variables which move together, but not at a constant rate (as with an exponential relationship), consider Spearman correlation. Spearman makes no assumptions as to linearity but simply assesses the relationship in terms of whether one variable increases when the other increases, and vice versa.Arithmetic vs Logarithmic Returns
While Arithmetic Returns are easily understood, as mentioned above, there are some good reasons for using a Logarithmic Return in certain occasions. Our took allows you to choose Arithmetic or Logarithmic returns.
Timeframe
The tool allows you to select the number of daily observations to consider when comparing returns to determine the data sets’ correlation.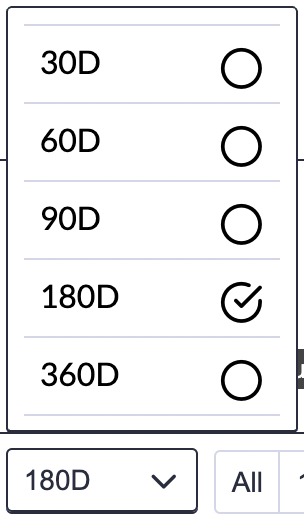
Handling of Data Gaps
On occasion, you may want to compare a continuous data series with one with gaps (such as when you compare cryptoasset returns with a traditional index like S&P500 that has no values on the weekends or holidays). The tool gives you two options for handling this:- Linearly interpolate the data to derive a value for the data gap prior to calculating the returns
- Exclude the observations on the dates where one data series has a gap, but the other doesn’t prior to calculating the returns (note: this results in fewer observations for the non-gapped series)

Interpretation
Let’s say you select a Pearson correlation of the logarithmic returns for the previous 180 days. This number means “in the 180 days leading up to the point on the chart you’re looking at, the two assets that you have selected had co-movement in their daily returns of a magnitude corresponding to x.” If x is 1, their daily returns were perfectly positively correlated in the 180-day period leading up to the date where you observe the coefficient of 1. If x is 0.3, their returns moved together more often than not, but they weren’t particularly closely linked.Constraints
Attempting to predict the future by looking at historical returns is always somewhat fraught. There’s no guarantee that a historical correlation will persist into the future. Because of this, we recommend looking for useful correlations over longer periods. Things that should grab your attention:- Very positive correlations between two assets, especially over longer periods of time. Consistently high correlations deserve investigation.
- Persistent negative correlations of any sort are tremendously interesting, albeit rare. The strength of the signal increases with the quantity of historical evidence.