

Data Sources
All data is sourced from the CM v4 API.- Network Data (EOD): Available through our Network Data Pro product
- Reference Rates: Specifically our daily 00:00 UTC, 12pm NYC, 4pm NYC, 10:30am London, 11:00am London, 3:15 Chicago
- Indexes (Daily Levels): Available through our CMBI product
- S&P 500 Index (https://fred.stlouisfed.org/series/SP500), which is an S&P Dow Jones Indices LLC product; note the daily value for this index is as of 4pm NY time
- Trade Weighted US Dollar Index (https://fred.stlouisfed.org/series/DTWEXBGS), which is a Board of Governors of the Federal Reserve System (US) product; note that the daily value for this index is 12:00pm NY time
- CBOE Volatility Index (https://fred.stlouisfed.org/series/VIXCLS), which is a Chicago Board Options Exchange product; note that the daily value for this index is 3:15pm Chicago time
Getting Started
This suite of charting tools can be accessed directly at Charts with or without an API key. Without an API key, you will have access to the community data from the above data sources.Using an API Key
If you are a client of our professional data and you have an API Viz key, you can enter your key by selecting the “key” on the top of the right toolbar. If you are a client, and you do not have a Viz key, contact us to obtain one. Each user needs their own Viz key, as these keys have special permisssions. Also, any charts saved to our cloud are saved to your user-specific key.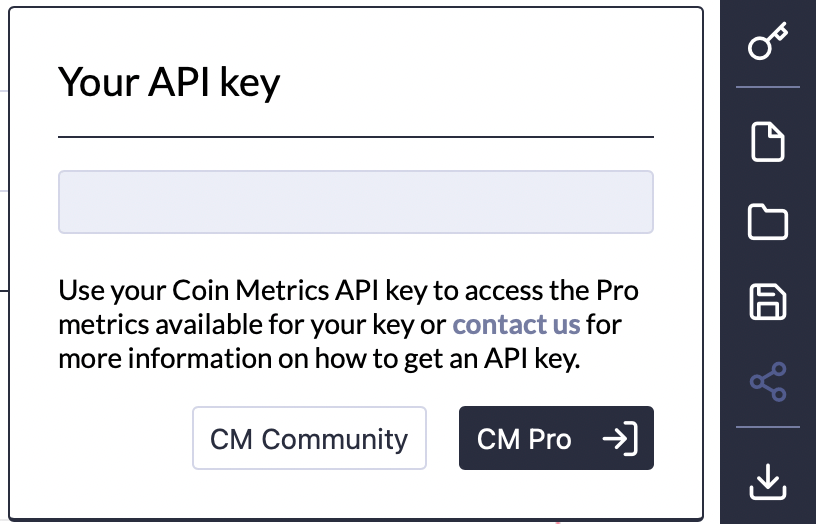
Saving Charts
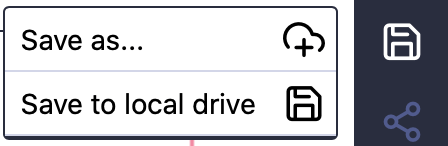
You can save your charts in all three of our tools. Simply select the “save” image on the right toolbar. There are two options for saving your charts:- Save as… (only available to users with a Viz API key) - save your chart to your API key and reload it later from any device. Charts saved to your API key can be “named” (given a title) and can be shared via a chart-specific URL.
- Save to local drive - save your chart to your local drive in a json format and reload it for later use.
Loading Charts
To load a previously saved chart, select the “folder” image on the right toolbar. If you saved your chart to your API key (to the Cloud), then “Load from cloud”. If you saved your chart to your local drive, then “Load from file”.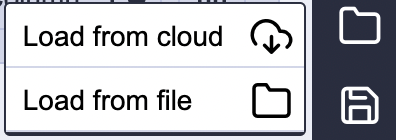
Sharing Charts
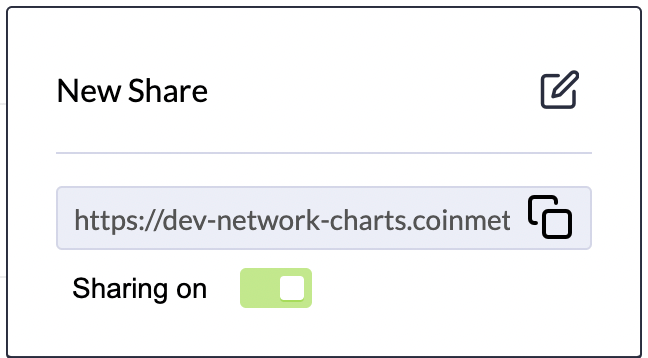
If you’d like to share a chart via a URL, you need an API via key. Once your API key is set, then, click the “share” button.
Downloading Charts
Charts can be downloaded to data files (CSV or XLS) or image files (PNG with our without a legend). Simply select the “download” button on the right toolbar. If you’d like to see a title on your chart, save your chart and assign a name. The assigned name will be your title.
Chart Options
There are several ways to adjust your plot in both the “Charting Tool” and the “Formula Builder”. These features are located on the bottom toolbar. From left to right below:- Lin/Log - adjust the vertical axes to a Linear or Logarithmic scale (the choice applies to both right and left axes)
- Line/Stacked Area/100% Stacked Area - chose a different chart type
- Average - select no average, a 7-day moving average, a 14-day moving average, a 30-day moving average, a 50-day moving average, a 90-day moving average and a 200-day moving average
- Right axis - chose which series you’d like to see on the right hand axis (RHS) (only on the primary charting tool, not in Formula Builder or Correlation Tool)
- All/1M/3M/1Y/YTD - chose your preferred X-axis range
