

- Historical snapshots — periodic point-in-time state of the whole book.
- Historical updates + snapshots — the full event-driven stream of level changes; reconstruct the exact book at any timestamp (
dataset=updates). - Real-time streaming — a live websocket that opens with a snapshot, then streams updates.
[price, size] message shape (a size of 0 removes a level), so the same reconstruction code works across all of them. This notebook is fully self-contained — every cell uses the Coin Metrics Python client directly — and it makes the point concrete by streaming a live sample, then replaying the exact same time window from the historical updates dataset.
Resources
This notebook demonstrates basic functionality offered by the Coin Metrics Python API Client and Market Data Feed. Coin Metrics offers a vast assortment of data for hundreds of cryptoassets. The Python API Client allows for easy access to this data using Python without needing to create your own wrappers usingrequests and other such libraries.
To understand the data that Coin Metrics offers, feel free to peruse the resources below.
- The Coin Metrics API v4 website contains the full set of endpoints and data offered by Coin Metrics.
- The Coin Metrics Product Documentation gives detailed, conceptual explanations of the data that Coin Metrics offers.
- The API Spec contains a full list of functions.
File Download
Download the notebook to run it yourself: sales_demo_order_book_updates.ipynbSetup
The only dependency is the Coin Metrics Python API client (pip install coinmetrics-api-client). The API key is read from the environment — never hardcode it.
Schema 1 — Historical snapshots
The simplest shape: a periodic snapshot of the whole book. Coin Metrics stores three snapshot products — the top 100 levels and all levels within 10% of mid every 10s, and the full book hourly. We pull the latest few (top-100) and show the top of the most recent one:<style scoped>
.dataframe tbody tr th:only-of-type {
vertical-align: middle;
}.dataframe tbody tr th {
vertical-align: top;
}.dataframe thead th {
text-align: right;
}
</style>
| bid_price | bid_size | ask_price | ask_size | |
|---|---|---|---|---|
| 0 | 63033.89 | 0.36320277 | 63033.9 | 0.09268223 |
| 1 | 63033.88 | 0.03 | 63035.48 | 0.05552568 |
| 2 | 63033.86 | 0.03 | 63036.42 | 0.00022309 |
| 3 | 63033.8 | 0.00079322 | 63037.05 | 0.01784664 |
| 4 | 63032.01 | 0.11820631 | 63037.61 | 0.0694071 |
Reconstructing the book
Both the update stream and the websocket deliver the same messages: asnapshot is the full state; an update carries absolute [price, size] levels where a size of 0 removes the level. To maintain the book, treat every snapshot as a full reset (a redundant-stream failover can emit an out-of-band snapshot), then apply updates in time order. That’s the whole algorithm:
updates rows — because they are the same message shape. Levels are drawn by rank (best bid/ask at the center, deeper levels outward) so the bars stay readable and never overlap:
Schema 3 — Real-time streaming
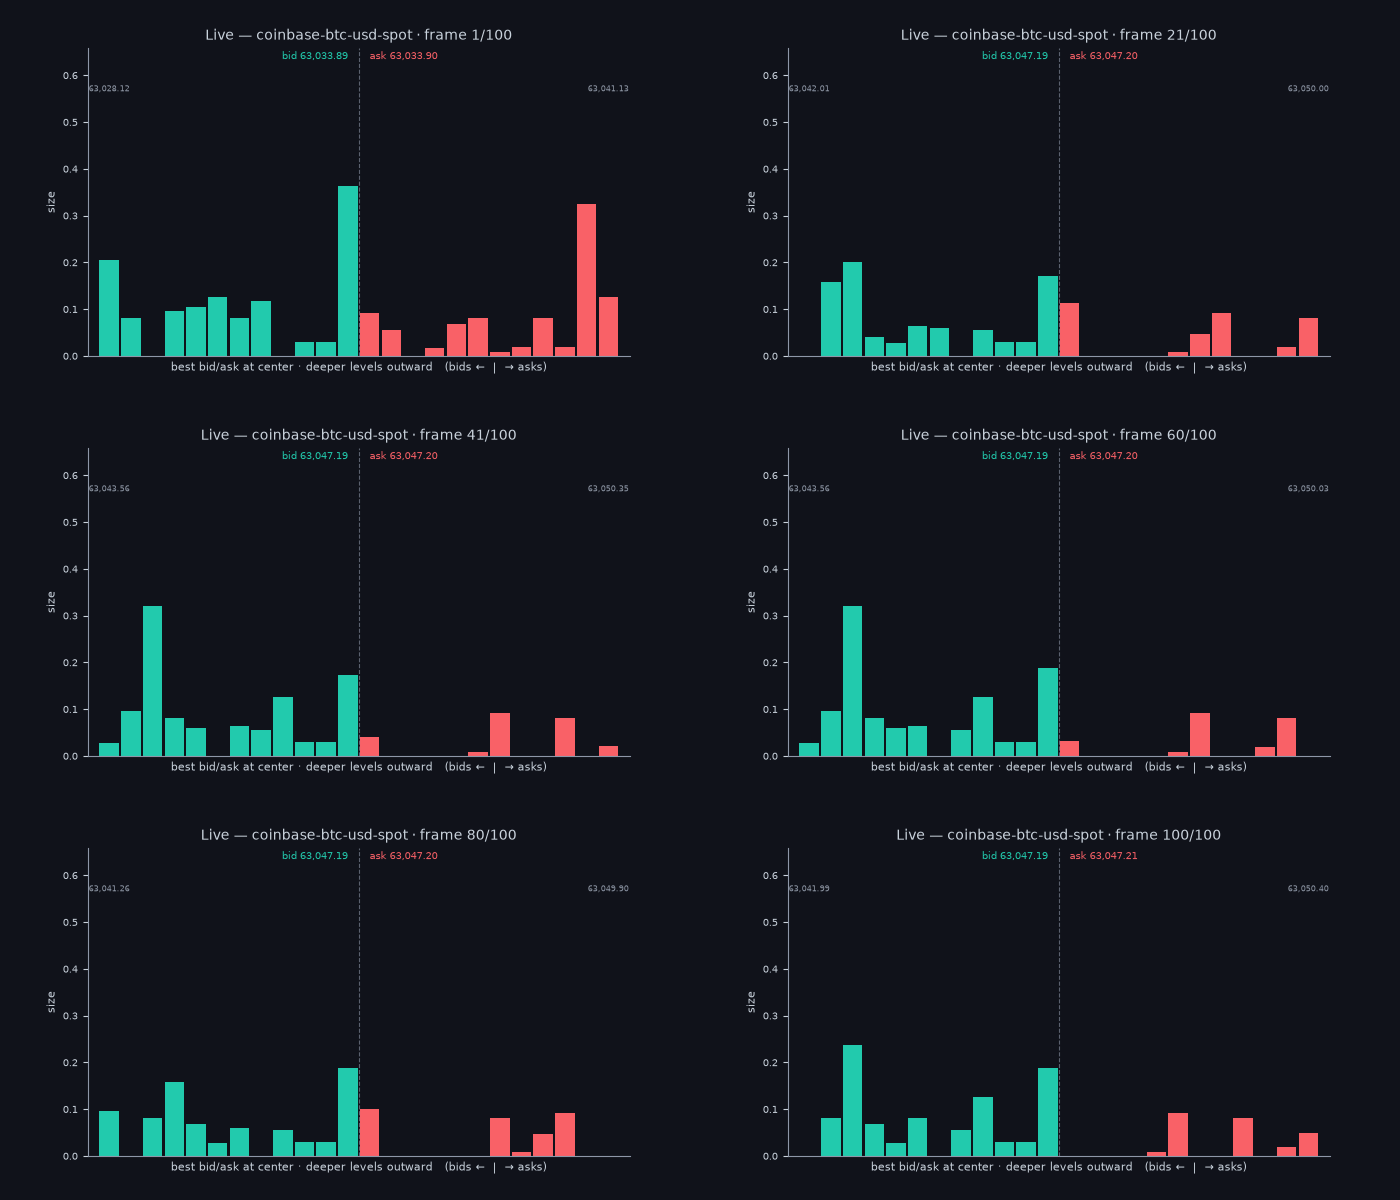
The websocket feed opens with asnapshot, then sends update messages as the book changes (with occasional re-sync snapshots) — the production path for a live book. We subscribe at depth_limit="full_book" (the stream defaults to top-100) so the live feed matches the historical updates dataset, which is full-book — making the two directly comparable. We take a small live sample and record the time window it spans, so we can replay exactly that window from history next.
This cell is live: its exact messages (and window) differ every run — unlike the historical replay below, which is reproducible.
Schema 2 — Historical updates + snapshots (replay the window we just streamed)
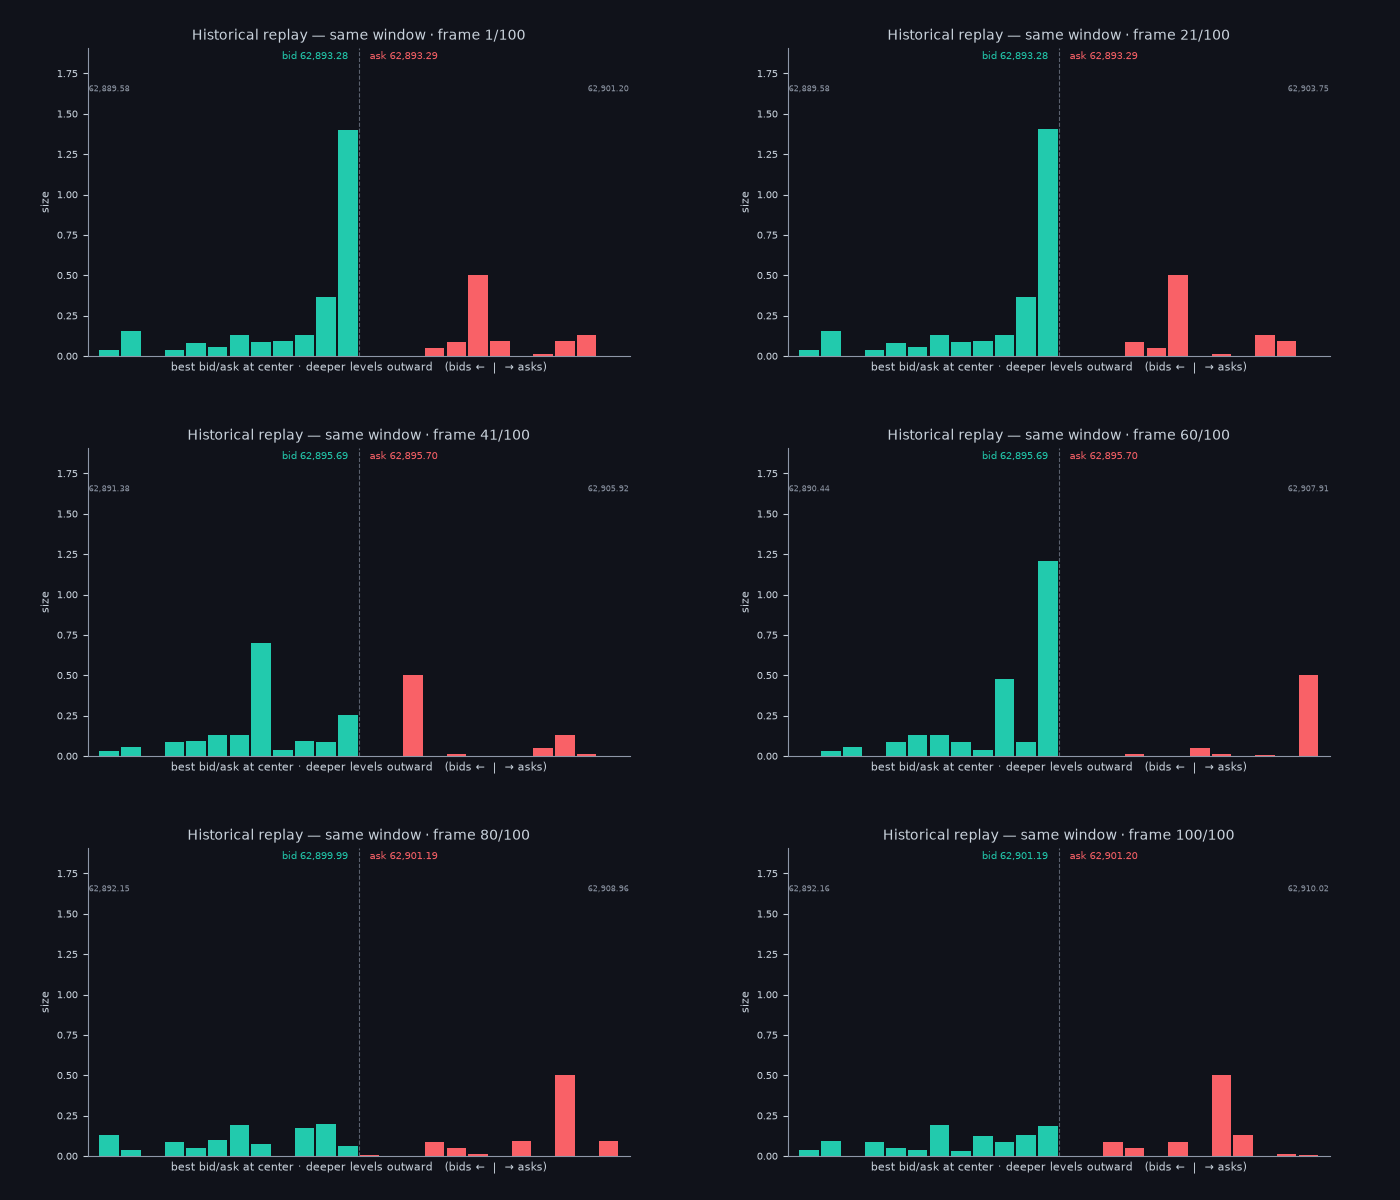
dataset=updates returns the identical message shape (snapshot + updates) for a historical window, and the sequence is reproducible — the same market and time range return the same rows on every query. Instead of a hard-coded window, we pass the win_start / win_end we just captured from the live stream — so we replay the very window we watched live. Following the product docs, we fetch it in parallel and return a DataFrame (.parallel(time_increment=…).to_dataframe()), then reconstruct with the same apply_message / animate_book code. start_with_snapshot=True prepends a snapshot so we can initialise before the first update.
Row count vs live-message count. Both feeds carry the full book (we subscribed the websocket atdepth_limit="full_book"to match). The websocket bundles many level changes into each message, while historicalgranularity="raw"emits them as finer, individual rows — so there are more rows than live messages, but the total book activity (level-changes) is comparable. Same book, same schema, same code — just different message framing.
Historical updates settle after a short persistence lag, so the final seconds of a just-streamed window may still be landing; the leading snapshot keeps the replay well-formed regardless.
<style scoped>
.dataframe tbody tr th:only-of-type {
vertical-align: middle;
}.dataframe tbody tr th {
vertical-align: top;
}.dataframe thead th {
text-align: right;
}
</style>
| market | time | coin_metrics_id | asks | bids | type | database_time | collect_time | |
|---|---|---|---|---|---|---|---|---|
| 0 | coinbase-btc-usd-spot | 2026-07-07 05:30:09.985257+00:00 | AAEDAAZV_q83wulCVEMtVVNE | [{‘price’: ‘62893.29’, ‘size’: ‘0.00141817’}, … | [{‘price’: ‘62893.28’, ‘size’: ‘1.40248756’}, … | snapshot | 2026-07-07 05:30:10.204346194+00:00 | 2026-07-07 05:30:09.999438+00:00 |
| 1 | coinbase-btc-usd-spot | 2026-07-07 05:30:10.013888+00:00 | AAEDAAZV_q84MsBCVEMtVVNE | [] | [{‘price’: ‘62871.98’, ‘size’: ‘0.540278’}] | update | 2026-07-07 05:30:10.204398185+00:00 | 2026-07-07 05:30:10.018256+00:00 |
| 2 | coinbase-btc-usd-spot | 2026-07-07 05:30:10.016763+00:00 | AAEDAAZV_q84PftCVEMtVVNE | [] | [{‘price’: ‘62872.11’, ‘size’: ‘0.48858106’}] | update | 2026-07-07 05:30:10.204419996+00:00 | 2026-07-07 05:30:10.024894+00:00 |
| 3 | coinbase-btc-usd-spot | 2026-07-07 05:30:10.016875+00:00 | AAEDAAZV_q84PmtCVEMtVVNE | [{‘price’: ‘62925.66’, ‘size’: ‘0.94122215’}, … | [] | update | 2026-07-07 05:30:10.204430666+00:00 | 2026-07-07 05:30:10.024923+00:00 |
| 4 | coinbase-btc-usd-spot | 2026-07-07 05:30:10.018792+00:00 | AAEDAAZV_q84RehCVEMtVVNE | [{‘price’: ‘62925.67’, ‘size’: ‘0’}] | [] | update | 2026-07-07 05:30:10.204440166+00:00 | 2026-07-07 05:30:10.024948+00:00 |
Reconstruct & measure
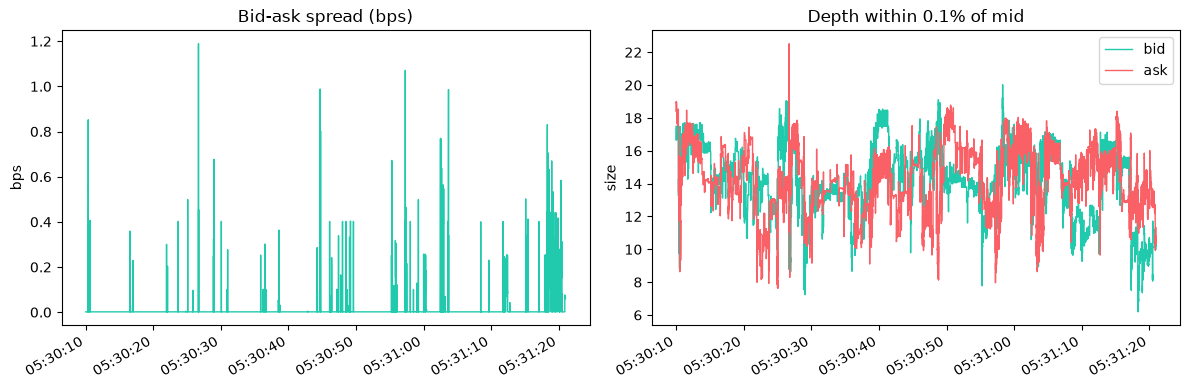
Replaying the updates in time order gives the level-1 series (best bid/ask, spread) and depth near the mid — the raw material for TCA, event studies, and backtests. The sameapply_message that drove the animations builds the metrics here:
<style scoped>
.dataframe tbody tr th:only-of-type {
vertical-align: middle;
}.dataframe tbody tr th {
vertical-align: top;
}.dataframe thead th {
text-align: right;
}
</style>
| spread_bps | bid_depth | ask_depth | |
|---|---|---|---|
| count | 52974.000000 | 52974.000000 | 52974.000000 |
| mean | 0.037895 | 13.749850 | 14.006826 |
| std | 0.110120 | 2.348151 | 2.138078 |
| min | 0.001587 | 6.192858 | 7.618362 |
| 25% | 0.001588 | 12.175648 | 12.528570 |
| 50% | 0.001589 | 13.971209 | 14.032747 |
| 75% | 0.001590 | 15.600170 | 15.622603 |
| max | 1.188795 | 20.020468 | 22.517797 |
Takeaways
- Three schemas, one data model. Historical snapshots, historical updates, and the real-time stream all share the same
[price, size]message shape. - One code path, live or historical. The same
apply_messagereconstructs the book from websocket messages and fromdataset=updatesrows — we even replayed the exact window we had just streamed live. - Treat every
snapshotas a full reset (not just the first) — a redundant-stream failover can emit an out-of-band snapshot. - Historical
dataset=updatesis reproducible, so research and production share the exact same book-building logic.