Python API Client Walkthrough
Last Updated: Version2024.08.20
This notebook demonstrates basic functionality offered by the Coin Metrics Python API Client using Coin Metrics Community Data.
Coin Metrics offers a vast assortment of data for hundreds of cryptoassets. The Python API Client allows for easy access to this data using Python without needing to create your own wrappers using requests and other such libraries.
Prerequisites
First, Python must be installed. Download and install from python.org. The Coin Metrics API Client is best used with Python 3.8 or later. Then, install the Python API Client:pip install coinmetrics-api-client
Some of the optional libraries such as pandas, numpy, and seaborn are used in the notebook to make the examples more interactive. These libraries are not required to use the Coin Metrics API Client.
You are now ready to run the code in the rest of the notebook.
Resources
To understand the data that Coin Metrics offers, feel free to peruse the resources below.- The API Reference contains the full set of endpoints and data offered by Coin Metrics.
- The Coin Metrics Product Documentation gives detailed, conceptual explanations of the data that Coin Metrics offers.
- The Python API Client space documents the client itself, including a full method reference.
- The Coverage Tool shows what assets, metrics, and other data types are covered.
Setup
Catalogs
The Coin Metrics API contains two types of catalog endpoints (Python client functions in paranthesis): thecatalog (catalog_*_v2) and catalog-all (catalog_full_*_v2).
The catalog endpoint displays the set of data available to your API key. The catalog-all endpoint displays the full set of data for our dataset.
catalog_asset_metrics_v2, each element of the list is an asset, while each dictionary is a set of metadata for that specific asset.
Getting Timeseries Data
Next, we will pull timeseries data. Typically there are two types of timeseries data that you can pull: raw observations such as trades and aggregated metrics. We will explore these two below.Asset Metrics
First, we will use theasset-metrics endpoint to get metrics for BTC and ETH.
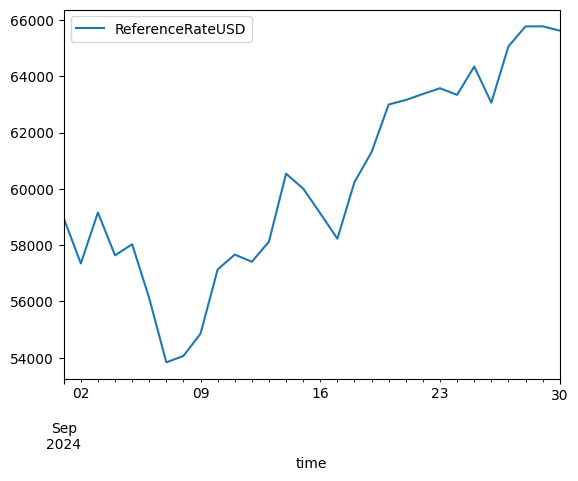
limit parameter.
Market Observations
The other common timeseries data type that you will encounter are individual observations. First, we will need to familiarize ourselves with the market convention which we can find on faqs. You can see a full list of markets by using thereference-data endpoint.
5 rows × 39 columns
5 rows × 37 columns
We can then pass these markets onto the
timeseries/market-* endpoints. Below is an example of how to pull individual market trades.
Examples from State of the Network
The Python API Client is often used for transforming data for State of the Network. Below are some examples of data transformations done to produce the data visualizations. Example 1: Get returns by coin in the CM reference rates universe over the last 10-years In State of the Network #128, we looked at the returns for each asset dating back the last 10 years.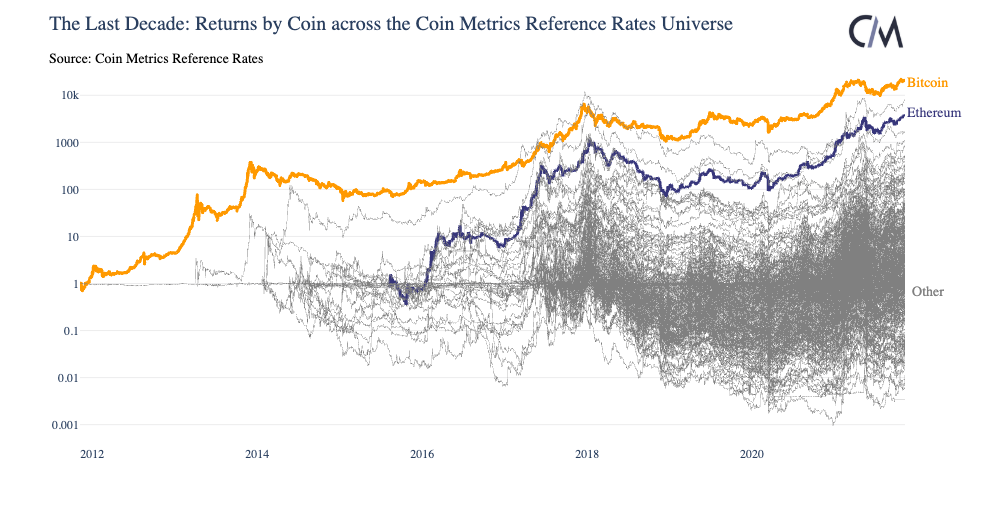 We can generate this data by weaving in the
catalog_asset_metrics_v2 and get_asset_metrics endpoint. The code snippets below demonstrate how to do this with a small list of assets.
Example 2: Get daily spot trading volume on Coinbase for USDC markets
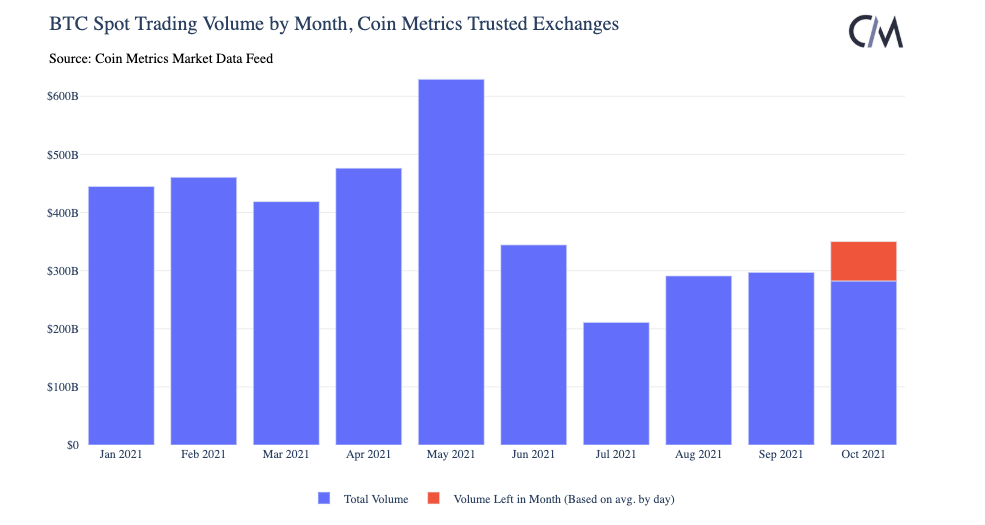
In State of the Network #126, we looked at spot volume on trusted exchanges over time. We can replicate similar data behind chart using just coinbase spot markets at 2021. Here, we derive volume from our
get_market_candles endpoint.
We can also break this down by month. Note that for this example, the volume numbers will look smaller because we are using fewer exchanges.